SatComm Optimizer

Project Overview
Before diving into my work with SatComm Optimizer, allow me to briefly explain the significance of this project. SatComm Optimizer is a personal project in collaboration with Anna Diaz, a Systems and Operations Management student from CSUN. Our focus is to develop and visualize algorithms that optimize satellite communication networks with real-time simulation. The project is based on Iridium’s Iridium-NEXT satellite constellation, a worldwide network of telecommunications satellites that provide access to voice and data services anywhere on Earth. Iridium’s ability to provide worldwide coverage has inspired us to develop algorithms to understand and possibly improve upon how Iridium-NEXT satellites interact with ground stations, create inter-satellite links, and optimize service delivery to customers.
Technologies & Tools
To achieve the objectives of the SatComm Optimizer project, we utilize a range of advanced technologies and tools. We leverage the strengths of JavaScript and Python to create dynamic visualizations and handle large datasets effectively. JavaScript is used to create dynamic, visually engaging simulations, while Python’s robust data processing capabilities allow us to manage and analyze extensive datasets. Additionally, for handling and visualizing the data generated by our algorithms, we utilize SQL and Tableau. SQL stores and processes data generated by our algorithms, while Tableau creates interactive visualizations and dashboards.
We utilize several libraries and tools that provide the necessary functions and data for accurate satellite modeling. CesiumJS is used to visualize the real time positions and capabilities of the Iridium-NEXT satellites, allowing us to create detailed and interactive representations of the satellite constellation. Satellite-js provides essential functions to propagate satellite orbits with sub-kilometer accuracy, leveraging the SGP4 model for precise calculations. Furthermore, CelesTrak sources the most up-to-date Two-Line Element (TLE) data for our satellite models, ensuring accuracy and reliability in our simulations.
These technologies collectively enable us to model, analyze, and visualize satellite communication networks with both precision and visual appeal.
Project Workflow - In Progress
Visualizations
Our simulation features 81 Iridium-NEXT satellites, with their positions updated in real-time using TLE data propagated through Python. This approach ensures positional accuracy within less than 1 km of error. Each satellite's orbital period is calculated using its current mean motion and semi-major axis, which are continuously updated during orbit. Additionally, we visualize each satellite's footprint, with a radius of 2,400 km, as specified by Iridium.
To process the information transmitted by the Iridium-NEXT satellites, we have integrated entities into our simulation representing the positions of each ground station utilized by Iridium. These ground stations are mapped in key locations, including Fairbanks, Alaska; Tempe, Arizona; Punta Arenas, Chile; Svalbard, Norway; and Izhevsk, Russia. This integration allows us to accurately represent the communication links between the satellites and ground stations, providing a comprehensive view of the network.
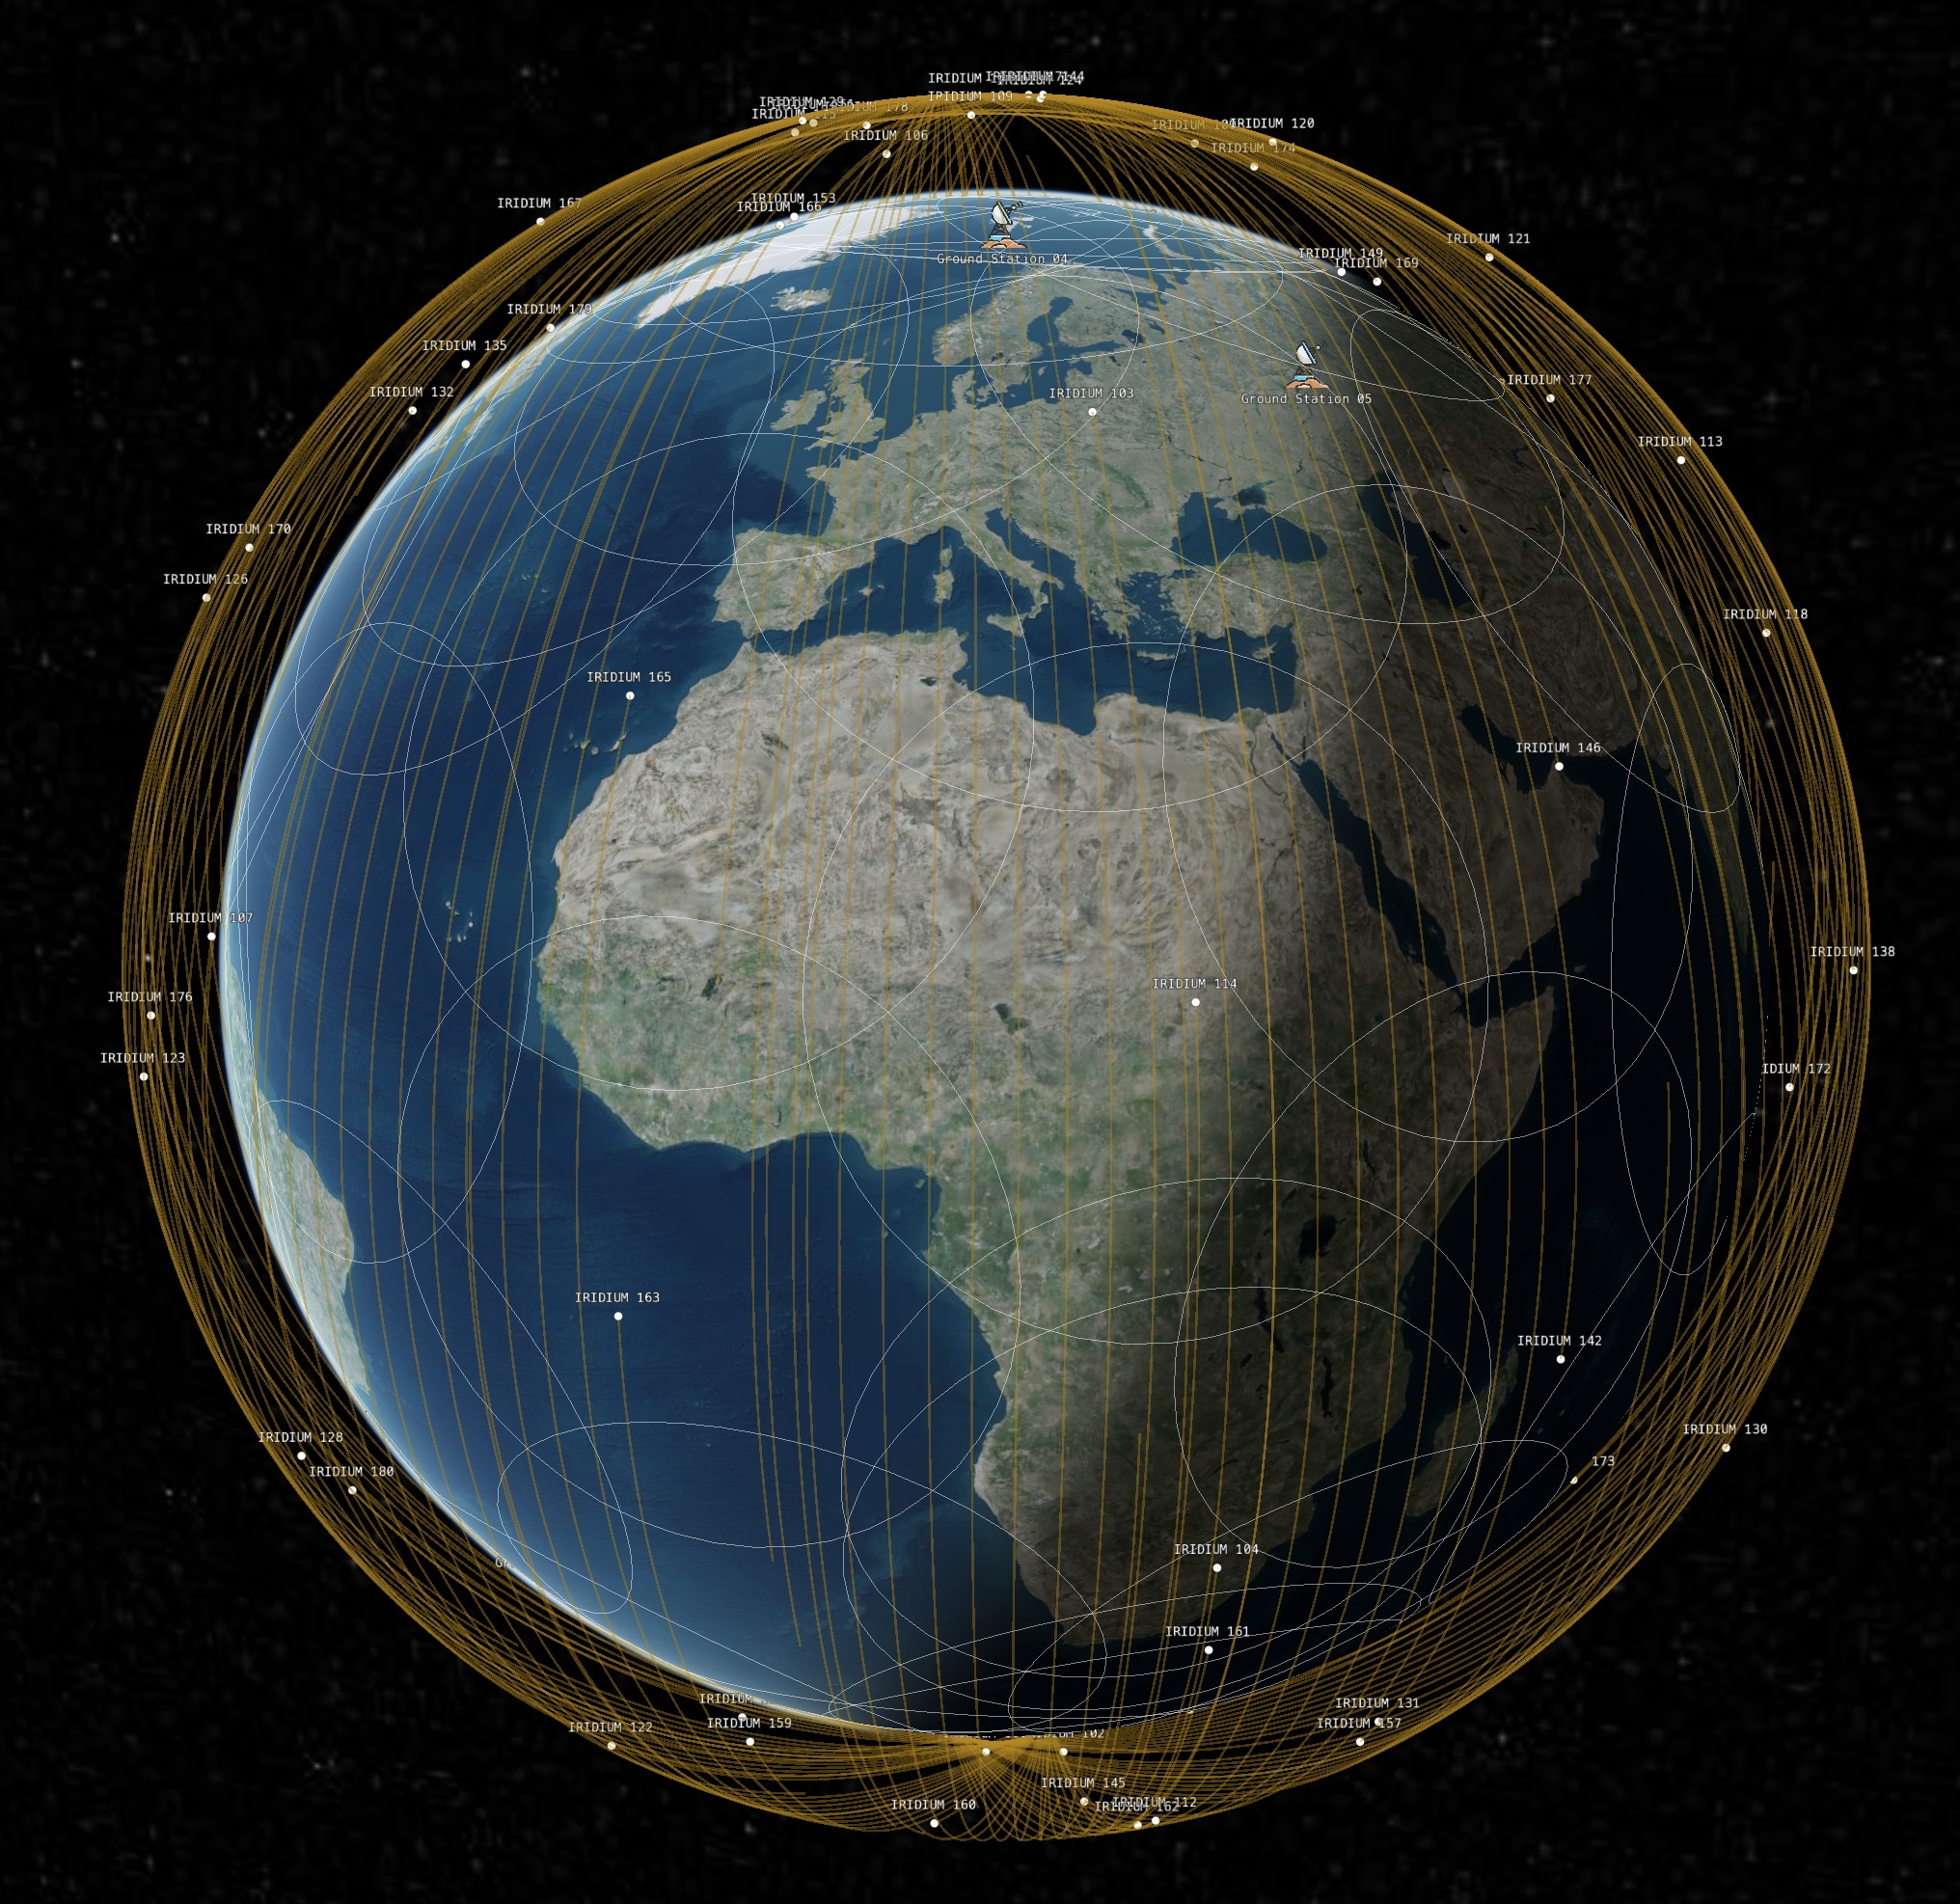
Iridium Network Visualization: Our simulation showcases all 81 Iridium-NEXT satellites with their orbits, footprints, and active ground stations.
Data Processing
SatComm Optimizer handles all data processing through Python, ensuring efficient management of the continuous influx of data. Using TLE data sheets provided by CelesTrak, Python fetches and parses the information, identifying the associated TLE data for each Iridium-NEXT satellite. This data is then used to perform essential calculations for satellite propagation. Python recalculates each satellite’s orbit and orbital period every few seconds to maintain accuracy. The processed data is then passed to our JavaScript environment for real-time visualization.
Simulation Demo: This demo illustrates how Python continuously calculates and propagates satellite orbits using live data.